Category Archives: General CMIPS info

New CMIPS v.1.0.5

We are proud to release a new version of CMIPS.

cmip-v-1-0-5-start-thread

This new release improves:

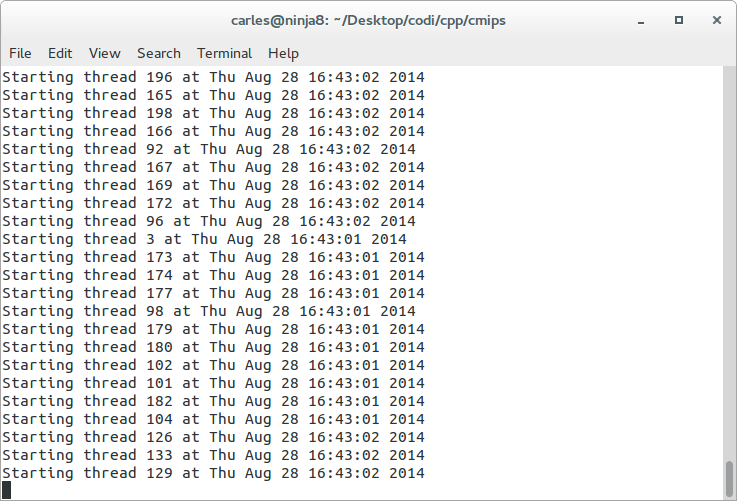
  • Number of threads updated to 200

As most powerful Commodity Servers are approaching to 100 cores we doubled the number of concurrent threads for the tests. Any Server bellow 200 cores can be tested.

The CMIPS score scale compatibility  is maintained, so values are consistent with older CMIPS versions, but times for the tests are doubled.

  • Info on max threads on the system is printed and written to cmips.log (/proc/sys/kernel/threads-max)
  • Info on CPU is printed and written to cmips.log (/proc/cpuinfo)
  • The output in the screen is also nicer
  • An explicit use of variable has been made just to avoid compiler optimizations in some C++ compilers (when the variables are not used)
  • Thread variables are isolated to the Thread scope
  • Improved code fore readability
  • Threads use local variables l_ prefix from MT Notation to clarify
  • Source code project updated to NetBeans 8.

The new information provided at the start of the cmips binary (also written to the log) includes the number of max-threads configured in the system and the CPU info found on /proc/cpuinfo.
Example:

CMIPS V1.0.5 by Carles Mateo - www.carlesmateo.com
Max threads in the system: 505827
(from /proc/sys/kernel/threads-max)
/proc/cpuinfo
processor    : 0
vendor_id    : GenuineIntel
cpu family    : 6
model        : 60
model name    : Intel(R) Core(TM) i7-4770S CPU @ 3.10GHz
stepping    : 3
microcode    : 0x9
cpu MHz        : 800.000
cache size    : 8192 KB
physical id    : 0
siblings    : 8
core id        : 0
cpu cores    : 4
apicid        : 0
initial apicid    : 0
fpu        : yes
fpu_exception    : yes
cpuid level    : 13
wp        : yes
flags        : fpu vme de pse tsc msr pae mce cx8 apic sep mtrr pge mca cmov pat pse36 clflush dts acpi mmx fxsr sse sse2 ss ht tm pbe syscall nx pdpe1gb rdtscp lm constant_tsc arch_perfmon pebs bts rep_good nopl xtopology nonstop_tsc aperfmperf eagerfpu pni pclmulqdq dtes64 monitor ds_cpl vmx smx est tm2 ssse3 fma cx16 xtpr pdcm pcid sse4_1 sse4_2 x2apic movbe popcnt tsc_deadline_timer aes xsave avx f16c rdrand lahf_lm abm ida arat epb xsaveopt pln pts dtherm tpr_shadow vnmi flexpriority ept vpid fsgsbase tsc_adjust bmi1 hle avx2 smep bmi2 erms invpcid rtm
bogomips    : 6385.11
clflush size    : 64
cache_alignment    : 64
address sizes    : 39 bits physical, 48 bits virtual
power management:

Source code can be downloaded from:
https://github.com/cmips/cmips

It is ready to be used with NetBeans 8.

And binaries only:

https://github.com/cmips/cmips_bin

How CMIPS binary and source code works for CPU and RAM benchmarks

I’ve been requested to explain how CMIPS works. Here I explain the basic mechanics of the source code for the CPU and RAM speed benchmarks.

Cmips uses a lot of my knowledge on computers, architecture, virtualization and assembler to prevent the hypervisors from devising the results, and providing fake data.

So at the end the program is a very precise one, concentrating into doing its jobs the best way possible.

It uses a very small binary file and really few amount of RAM to prevent the Host hypervisor from improving or worse the pure results (some providers allow the tenants to use more total RAM than the host server actually have, as many times only a part of the RAM assigned to the instances is really used, and uses swap the same way a computer does if RAM is really used).

Basically it calculates the CPU speed, by doing simple calculations involving the hardware registers and the read and write access to memory speed.

For the writings to the memory only one byte is written, and different, to minimize the hardware and software caches optimizations.

The operations are the simplest, the most close to assembler basic functions.

Operations are:

  • Increase counter
  • Compare if greater
  • Assign var to 0
  • Read a byte from a position of memory (read a char)
  • Write a byte to a char variable

So there are no callings to the Operating System that can be tweaked by the Hypervisor / guest tools or containers.

Finally cmips launches 100 threads (void *t_calculations(void *param)) at the same time to stress all the cores available, and provide a real benchmark on the independent CPU power of the public instance (some host servers isolate or share resources more than others, so cmips claims all the resources to get the real picture of performance provided).

When we benchmark an instance, we block the firewall to prevent incoming petitions from wasting resources and we launch cmips several times, one time after the other, on the same instance to be sure that the results are consistent and reliable.

Netbeans is used as IDE for the cmips source code. (For my Linux C++ GUI apps I use Qt Creator)
That’s the basic code in C++

Using those libraries:

#include <cstdlib>
#include <iostream>
#include <stdio.h>
#include <stdlib.h>
#include <pthread.h>
#include <fstream>
#include <sstream>
#include <cstring>
#include <sys/time.h>
#include <ctime>

using namespace std;

So we link the program with the standard Posix thread library:

-o ${CND_DISTDIR}/${CND_CONF}/${CND_PLATFORM}/cmips -lpthread

Some global variables:

typedef unsigned long long timestamp_t;

char s_cmips[50] = "CMIPS V.1.0.3 by Carles Mateo www.carlesmateo.com";
char s_tmp_copy[1];

int i_max_threads = 100;
int i_finished_threads = 0;

int i_loop1 = 0;
int i_loop_max = 32000;
int i_loop2 = 0;
int i_loop2_max = 32000;
int i_loop3 = 0;
int i_loop3_max = 10;


The core is this thread function:

void *t_calculations(void *param)
{

    // current date/time based on current system
    time_t now = time(0);
    int i_counter = 0;
    int i_counter_char = 0;

    // convert now to string form
    char* dt_now = ctime(&now);

    printf("Starting thread ");
    cout << dt_now << "\n";
    for (i_loop1 = 0; i_loop1<i_loop_max; i_loop1++)
    {
        for (i_loop2 = 0; i_loop2<i_loop2_max; i_loop2++) 
        {
            for (i_loop3 = 0; i_loop3<i_loop3_max; i_loop3++) {
                // Increment test
                i_counter++;
                // If test and assignement
                if (i_counter > 32000) {
                    i_counter = 0;
                }
                // Char test
                s_tmp_copy[0] = s_cmips[i_counter_char];

                i_counter_char++;
                if (i_counter_char > 49) {
                    i_counter_char = 0;
                }

            }
        }   
    }

    time_t now_end = time(0);

    // convert now to string form
    char* dt_now_end = ctime(&now_end);

    printf("End thread at ");
    cout << dt_now_end << "\n";

    i_finished_threads++;

    return NULL;
}

The timestamps is calculated:

static timestamp_t get_timestamp ()
{
  struct timeval now;
  gettimeofday (&now, NULL);
  return  now.tv_usec + (timestamp_t)now.tv_sec * 1000000;
}

After all the threads finish main calculates:

    // Process
    timestamp_t t1 = get_timestamp();

    double secs = (t1 - t0) / 1000000.0L;

    int cmips = (1 / secs) * 1000000;


How CMIPS cloud-init tests are done

To test aspects like the time that a server takes to become available there two approaches can be used:

1) Manually laborious launch the instance creation order (from web or from API call) and start the counter of a chronometer

Then keep refreshing for the instance id to get the public dns name, or Ip, and then ping to know when the interface is up, then keep trying to access via ssh.

Stop the chronometer…

2) Go more pro and automate test through Cloud-Init procedure

That’s specifying your script, that will be executed when the instance starts.

This is done in Amazon through the User data.

cmips-amazon-user-data-scriptThere you can provide your scripts in plain text, in base64, or add as a file and they are executed as root.

In our case I created my scripts to automate tests and save time, while being more accurate.

Sample User data script for cmips tests:


#!/bin/sh
# cmips v.1.0.3 cloud init execution tests

# Define routes
file_name=cmips-speed-test.000

# Complete Path, on cloud-init through user data $HOME is empty, so data will be at /
# user data script is executed as root, so no problem of permissions
file_route=$HOME/$file_name

# Get the time when the server is up
date_server_up=`date +"%Y-%m-%d %k:%M:%S:%N"`
date_server_up_unix_time=`date +"%s"`

# In case invoked from command line, show some info
echo "Using logfile $file_route.log Server up: $date_server_up Unix Time: $date_server_up_unix_time"
echo "-----------------------------------------------------------------------------------" >> $file_route.log
echo "Server up: $date_server_up Unix Time: $date_server_up_unix_time" >> $file_route.log

# Add packages you want
apt-get install htop >> $file_route.log
apt-get install git >> $file_route.log

# Here you can add packages like mysql, apache, php... and monitor the time
# You can also clone from github your source code to deploy your web

$date_end_packages_install=`date +"%Y-%m-%d %k:%M:%S:%N"`
$date_end_packages_install_unix_time=`date +"%s"`
echo "Package finished installing at $data_end_packages_install Unix Time: $date_end_packages_install_unix_time" >> $file_route.log

# Do Connection Speed tests
# ...

# Do cmips tests
# ...

# Get start of time for disk speed calculations
date_start_dd_unix_time=`date +"%s"`
date_start_dd=`date +"%Y-%m-%d %k:%M:%S:%N"`

echo "Starting cmips dd tests at $date_start_dd Unix time: $date_start_dd_unix_time"
echo "Starting cmips dd tests at $date_start_dd Unix time: $date_start_dd_unix_time" >> $file_route.log

dd if=/dev/zero of=$file_route bs=4M count=64 >> $file_route.log ; sync

date_end_dd_unix_time=`date +"%s"`
date_end_dd=`date +"%Y-%m-%d %k:%M:%S"`
total_seconds=`expr $date_end_dd_unix_time - $date_start_dd_unix_time`

echo "Ending cmips dd tests at $date_end Unix time: $date_end_dd_unix_time Total seconds dd with sync: $total_seconds"
echo "Ending cmips dd tests at $date_end Unix time: $date_end_dd_unix_time Total seconds dd with sync: $total_seconds" >> $file_route.log

In /var/log you can find the cloud-init.log file and examine it in deep if you’re curious.

I use dd to get data about disk performance. Is not so evident in Cloud, as all the Virtual platforms cache the file I/O from the guest instances, so tests with smalland medium-sized files are not trustworthy, and so certain aspects have to be taken in count:

  • Test with big files: 1 GB or bigger
  • Use block-size 4 MB at least
  • Use sync, and calculate the real time it takes to release (even if is the Host and not the guest who controls that, it brings more accurate results)
  • Do several tests, can have disparity in results
  • Use /dev/zero . To really prevent caching I would prefer to use /dev/urandom but it really slows the tests and distort the results

How measurements are done

To measure the performance of an instance or a server CPU, I do several things.

After I create the instance I block the Firewall, so no one trying to discover vulnerabilities or playing with other’s servers can deviate the tests by overloading the CPU.

I htop to be sure that the server is between 0% and 2% CPU usage. After I ensured that, I do two tests. One, I note the result, and another a bit later, I note the result and compare to be sure that are accurate and no process caused a deviation.

To see the model of the CPU in the host I run the command:

grep -i --color "model name" /proc/cpuinfo

/proc/cpuinfo of an Intel Core i7-4470S CPU at 3.10GHz - 8 Cores

I note this info with the number of cores provided by htop.

I monitor and have more much info, like the time that take to start an instance, size of the disk, price per hour, position relative in performance to that provider’s offer… but I do not provide all this information by the moment in the web page.

Other cool indicators are speed to write/read to disk, outboud bandwidth pipe allowed per instance size, price per extra Gigabyte, if inbound packets are charged also, speed in connection to the same Lan instances (Gigabit, 10 Gigabit, etcetera), latency to Europe and US…

To register disk write speed I use random data and big files with this dd command:

dd if=/dev/urandom of=cmips-speed-test.000 bs=1024 count=5000000


Welcome to cmips

Welcome to CMIPS, Carles MIPS.

CMIPS is a program written in C++ by Carles Mateo with the purpose of sharing the different measurements of performance from Cloud Providers.

I’ve seen great differences in performance, time serving dynamic web pages (mostly PHP), and in price per hour from different Cloud providers, so often I asked myself what real speed one of the Instances/Virtual machines had, what was the best instance size suitable for my needs and what was the cost per unit of power, and what was the best price/performance provider. So I decided to write cmips and run in all the Cloud Providers instance sizes, and in some Physical Dedicated Servers as well to compare performances.

CMIPS is written in C++ and compiled in 64 bits. I’ve also a 32 bit version but I did only for testing Raspberry Pi. And a support for windows also, that I’ve never tested. 🙂

CMIPS is multithread and V.1.0.3 launches 100 threads to get an accurate idea of the servers performance of those servers with so many cores.